Sunday, April 29, 2012

CLM12 - Update for April 27, 2012

Price chart analysis for CLM12 for the week of 04/27/12:

 (Added Monday April 30th)


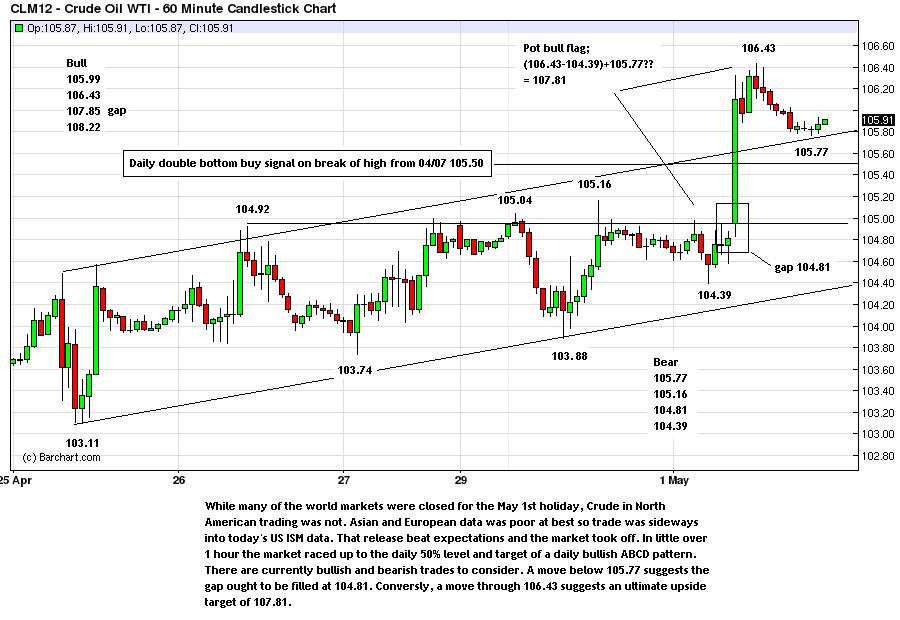
(Added Tuesday May 1st)
(Added Wednesday May 2nd)
(Added Thursday May 3rd)


Market Overview: The seasonal push into the official kick-off of the summer driving season (May 24 weekend) continues to produce bids for Crude. The bullish resolution (in the short term) on the weekly charts at key support suggests we can at least see a test of the late winter highs with a little less than a month to go in this bullish seasonal window. The pace of inventory builds has slowed but still sits at historically high levels suggesting there is a case to be made for a serious correction in price at some point down the road. That isn't now and given CoT's continued bullish stance, price may need to move higher for at least a few more weeks to come.

Trading Strategy (1 week): Sellers were indeed exhausted on that last leg down. Fib numbers suggest a move into the 105.50 area isn't out of the question in the short term with an ultimate blow off top coming in on a test of the daily 50% level around 106.25. The trend in the short term is higher but because of the volatile nature of Crude's trade, there is plenty of opportunity on the short side too. A move through 104.63 could produce a test of the 104 area and the 50% level is another $.60 lower than that. While I will be looking for long entry points (as long as we keep making higher highs and higher lows) I am not averse to shorting for a quick .10-.20 profit either. 104.63 and 105.00-105.06 shall be the marks I will be watching for Sunday evening & Monday morning.
Trading Strategy (1 month) While I do expect the market to fill the daily island gap at 107.64, I think that is in the weeks rather than days ahead . Additionally, I believe there is a lot of overhead resistance between 107.64 to 11.30 so one ought to be either taking profits or considering shorts should we spike up into that area. Sell in May and walk away...


That's all for this post,
Brian Beamish FCSI
The Canadian Rational Investor
the_rational_investor@yahoo.com
http://www.therationalinvestor.ca

Sunday, April 22, 2012

CLM12 - Update for April 20, 2012

Price chart analysis for CLM12 for the week of 04/20/12:


(added Monday April 23)

(added Tues April 24)
(added Wed April 25)
(added Thurs April 26)


Market Overview: While historic highs in crude inventories and a cooling of international tensions has blunted the dramatic move higher in price seen over the winter od 2012, the daily correction in Crude oil is now greater than 30 days and feels like it wants to turn. While heating oil has topped, unleaded has yet to in earnest. Is there one more push high into the official kick off to the summer driving season (May 24 weekend)?

Trading Strategy: As with many commodity markets over the past few weeks, we have been drifting rather than trending in earnest. It is interesting to see recent CoT reports confirm the weekly and monthly bullish tone to the overall market. Sellers seem exhausted here so I shall be looking for a grind higher here into the seasonal peak of late May. A 50% retracement of the daily sell off would bring us back into the 106 area and I am still looking for a move to fill in the island top (gap at 107.85) at some point in the not too distant future. Having said that, if inventories continue to build, economic data continues to weigh and there is further talk of Fed Stimulus needed, price could easily fall back below $100/barrel. I will be watching Friday's late price action range (104.68-103.22) for an indication of where we might be headed in the near future.


That's all for this post,
Brian Beamish FCSI
The Canadian Rational Investor
the_rational_investor@yahoo.com
http://www.therationalinvestor.ca

Sunday, April 15, 2012

CLK12 - Update for April 13, 2012

Price chart analysis for CLK12 for the week of 04/13/12:


Market Overview: While the weekly and monthly charts continue to suggest higher prices, the daily chart has now been pointing lower for more than 20 days and we are still pointing down. For the past two weeks we have flirted with the weekly MA and have not broken down suggesting this are may represent a short term bottoming point. Should we fail through $100.98 a move to fill in the weekly gap at $98.67 shouldn't be unexpected. Fundamentally, warehouse stocks continue to sit at historic highs suggesting prices are not justified being so high. Indeed, through the past week Saudi ministers reiterated this fundamental message. However, given the seasonal pressures on unleaded gasoline and international tensions with Iran and North Korea, one may have to wait a bit for prices to correct in earnest.

Trading Strategy: While there may be a short term long trade through 102.95, one must respect the fact that this market has not bottomed in earnest. Should that bullish move come, a subsequent move above $103.38 would put prices back into the uptrend channel and would suggest a test $104.24. Conversely, should $102.61 be breached I will be looking for a serious test of the recent support lows at .45 & .39. Given it being Monday, I would look for a gap opening through the overnight trade and base my trend decision on how that gap plays itself out.


That's all for this post,
Brian Beamish FCSI
The Canadian Rational Investor
the_rational_investor@yahoo.com
http://www.therationalinvestor.ca

Sunday, April 8, 2012

Update for April 06, 2012

Price chart analysis for CLK12 for the week of 04/06/12:


Market Overview: Bearishly, warehouse stocks of crude have been rising dramatically as $100/b oil is taking its tole on the broader economy. Additionally, a stronger US Dollar index is putting downward pressure on price. Bullishly, tensions with Iran are at a very high pitch & a rebounding world economy would imply a greater demand for energy. Two daily downward price targets have been hit and prices are currently trying to establish a bottom. A push through Friday's highs would imply a bullish tone to the market. The initial upside price target would be $105.21 but prices could easily rally to fill in the daily island gap at $107.33. Conversely; if  $101.30 fails look for the big-round $100 to be tested in earnest with an ultimate target of the weekly gap at $98.67.


Trading Strategy: Because of the significant double bottom ($102.43) I am currently leaning bullish and will use pull-backs to the trendline (marked as 'V' on the chart) to enter long positions. If a top develops I will change my stance in that I will be looking for a 50% retracement of the recent rally ($102.40 area) and then a test of the recent lows ($101.30 area). If those areas fail we could see a quick drop below $100...


That's all for this post,
Brian Beamish FCSI
The Canadian Rational Investor
the_rational_investor@yahoo.com
http://www.therationalinvestor.ca

Sunday, April 1, 2012

The long slog of becoming a successful day trader

Hello all,

As is the case with almost everything in life, being a successful and consistent day trader takes a lot of discipline and hard work. Doing so in one singular market on a regular basis is even harder.Over the past few months I have learned from first hand experience this fact. Prior to joining TopStepTrader's Combine challenge, I had the luxury of shopping the entire universe of stocks, commodities and options for particular trade set-ups. This luxury often ment that I could go from trading Corn options to owning a $2 million market cap. stock. While I continue to shop the broader market and am now considering a few longer term options positions, the learning curve at TopStep is still rather steep and has consumed a very good deal of my time. Rather than pos recent examples of trades, I am going to use this blog to point out (primarily for myself) the daily and weekly trends as well as a 30 minute bullish and bearish scenario with potential trigger points, associated stop levels and corresponding targets.

Here then is this week's (week of March 30, 2011) post:


That's all for this post,
Brian Beamish FCSI
the_rational_investor@yahoo.com