The first picture is the daily, weekly and 120 minute charts with Crude Oil's term structure and CoT summary for the week of Nov. 1st, 2013. Each trading day (time permitting) a 15 minute chart is added and trades for that day are reviewed:

Weekly highlight: As mentioned above, crude oil prices dropped appreciably over the course of the past week. So too have the by-products (heating oil & unleaded gas) suggesting North American energy demand may be waning at these lofty levels. Adding further weight to this thesis, Brent / WTI spreads have been widening of late suggesting the European economy is robust and local demand strong. Several macro issues are influencing energy prices too. From the unwinding of massive long positions by bankrupt Brazilian tycoons to the opening of new supply pipelines out of Cushing Oklahoma, there is no shortage of reasons for energy prices to have paused of late. While a few short term downside targets have been hit (small bear ab=cd on 2hr chart & weekly 50% level) several larger downside targets remain (large bear AB=CD on 2hr chart & key low tests on the daily and weekly chart). Rallies into resistance remain good shorting opportunities while panic sell-off lows remains speculative buying opportunities.
Personal journal: I am very proud of myself for exercising extream patients and discipline through my self imposed LTP. While I didn't knock the cover off the ball (up a net 30 ticks over the two week period) I did meet my simple requirement of trading like a professional for two consecutive weeks and only taking legitimate trading plan setups. I shut down twice through that period (hitting personal loss limit) but percerviered through the period and did indeed see that through consistency and focus, profits can be made. I feel as though TsT has been very patient with me and it is time for this little baby bird to fly.
Trading Plan: All trades from here on are LIVE. HVT setups where price has entered an OTE zone, momentum is currently in diveregence on 15m/3m, price is above or below daily Volprofile VH/VL and re-entering it and 3 bar 1m price reversal pattern as entry. All orders entered on an AOCO basis on the completion of 1m 3bar pattern at entry level. AOCO Stop at no more than -14, exit must be at least 1.5 times risk or +21 ticks. Order should rest near 38.2% retracement of prior move, PoC, Recent H/L. MUST SHUT DOWN on 2 initial losses or breach of 50% highwater mark on the day.
That's all for this post,
Brian Beamish FCSI
The Canadian Rational Investor
the_rational_investor@yahoo.com
http://www.therationalinvestor.ca
http://crisdaytrading.blogspot.ca/
Brian Beamish FCSI
The Canadian Rational Investor
the_rational_investor@yahoo.com
http://www.therationalinvestor.ca
http://crisdaytrading.blogspot.ca/
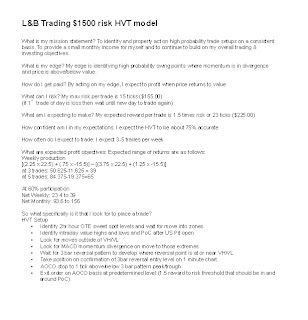
Screenshot of current L&B trading plan:
No comments:
Post a Comment